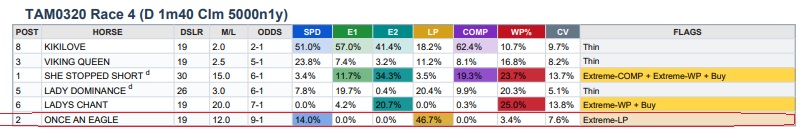
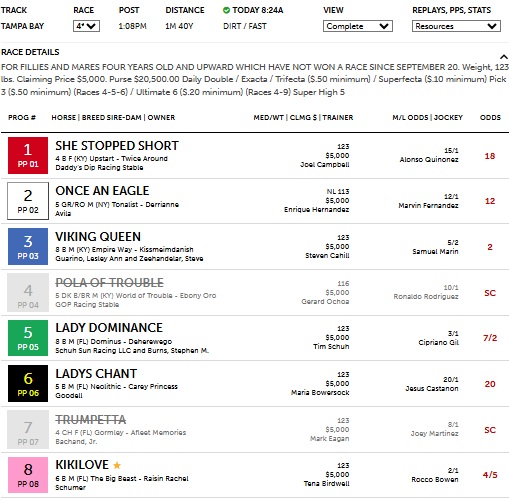
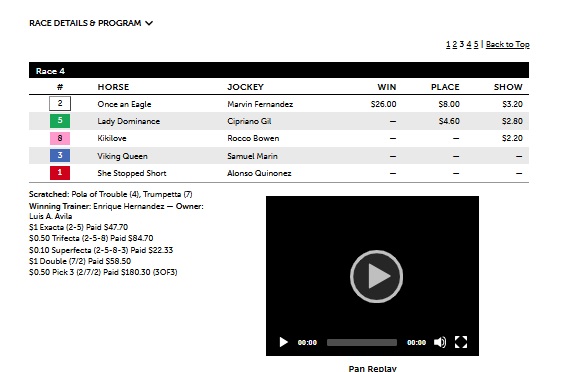
It’s often a mystery to many horseplayers and casual observers how to find winning mid to low-tier horses or those priced in high single digits to low double-digits in terms of odds. It’s not a mystery, though, when the math explains it and the math is right. The Track-IQ Overlay Map is precisely the type of tool that illuminates opportunities with such horses by comparing their metrics, converted to odds, to their M/L prices. The Overlay Map goes even so far as to flag such horses in the case of extreme signals and color shade them according to the degree of undervaluation for a given metric. In race 4 at Tampa, a $5K claiming race at 1m 40y on the dirt, the Map flagged #2 Once an Eagle at 12-1 for Extreme LP. The horse’s LP and SPD win probabilities were 46.7% (about 2-1 equivalent strength) and 14% (6-1 equivalent strength). Light however was the horse’s WP at 3.4%. To take this horse would be a play on his form versus the field rather than on his historical win percentage. In the race, the horse did not disappoint down the stretch, turning it on inside the last sixteenth in the center of the track to get the upset. Once an Eagle paid $26.00 for the win. A key factor in this outcome was the horse’s Coefficient of Variance of 7.6%, which indicated the horse was reliable and had low risk.
Race 4
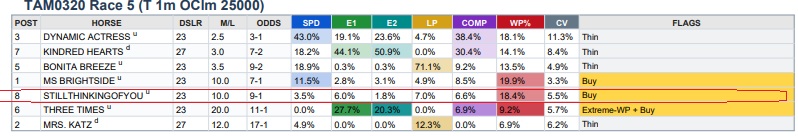
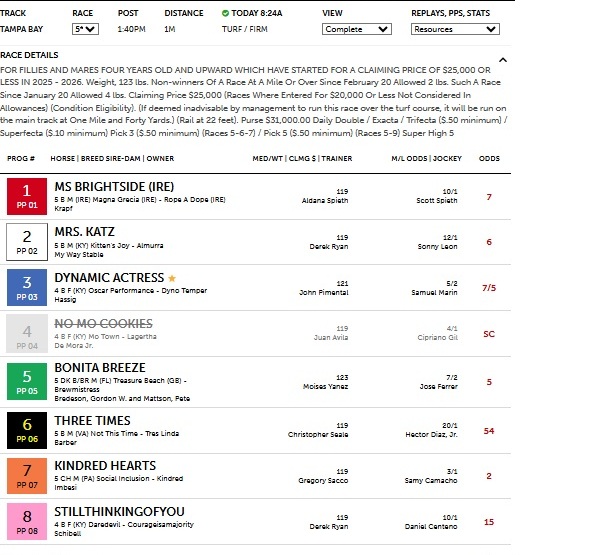
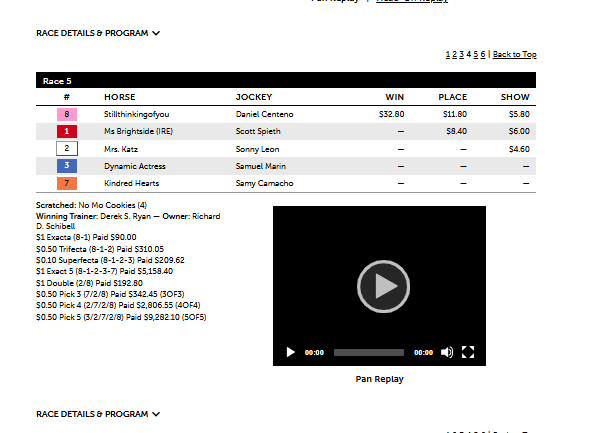
Race 5
In the very next race, in race 5 at Tampa ($25K OClm at 1 mi. on the turf), the Overlay Map identified #8 Stillthinkingofyou as a “buy”, indicating the horse was underpriced in terms of historical win percentage, adjusted for stakes, compared to his M/L. The horse was priced at even more of a discount in the live odds at 15-1 compared to 12-1 M/L. Stillthinkingofyou won down the stretch in the upset; in reality, the horse had historical winning strength of about 9-2. This race showed the horse bouncing back to more of his career winning form.