Overlay Map
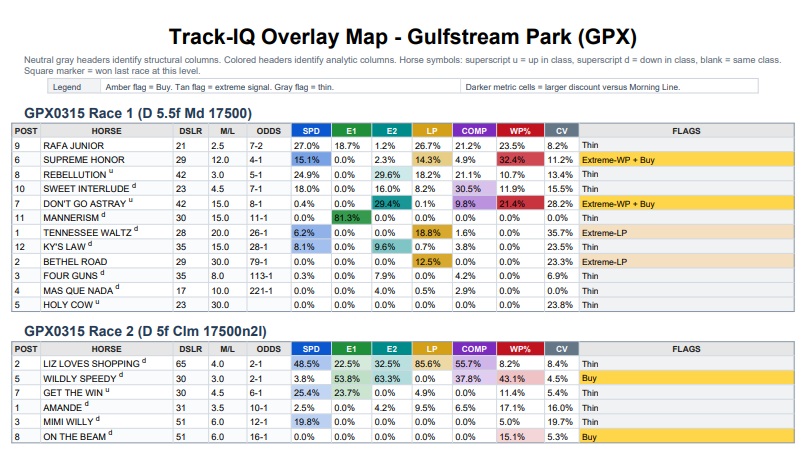
The Track-IQ Overlay Map provides a mathematical overview of each race, allowing the handicapper to see the statistical structure of the field in one clear view. The map brings together the key performance factors that drive outcomes—speed (SPD), early pace (E1/E2), late pace (LP), composite strength, and win probability (WP%)—and organizes them into a single visual grid. By doing this, the map reveals what is truly behind the live odds a horse receives in the betting market. Instead of treating odds as mysterious market signals, the Overlay Map shows the underlying performance metrics that influence how a horse is likely to perform against the field.
The core principle of the system is a direct comparison between the model’s calculated win probability (WP%) and the Morning Line odds. When the model estimates that a horse’s chances are stronger than the Morning Line suggests, that difference represents a statistical discount. The Overlay Map highlights these discounts through intelligent shading and signal markers so that favorable opportunities become immediately visible. Darker shading indicates a stronger discount relative to the Morning Line, while signal flags identify horses where the model believes value may exist.
In addition to highlighting value, the map also identifies extreme statistical signals—cases where a horse stands out significantly in key categories such as speed or late pace. These signals can point to runners capable of outperforming expectations when race conditions align with their strengths. By combining probability analysis, performance metrics, and visual signals, the Overlay Map transforms complex handicapping mathematics into a practical tool that helps bettors quickly recognize where the market may be offering a favorable opportunity.
Below is the full Overlay Report for Gulfstream Park from Sun., Mar. 15, 2026
https://www.equibase.com/static/chart/summary/GP031526USA-EQB.html
For more real-life results with the Overlay Map, see the Handicapping Page.
