Track-IQ Report
Track-IQ is a race analysis framework built to convert complex probability modeling into clear, practical insight for handicapping decisions. The system uses large-scale race simulations, statistical probability estimation, and pattern recognition techniques to evaluate how a race is most likely to unfold. Instead of relying on single figures or subjective rankings, Track-IQ analyzes the interaction of the key forces that shape every race—pace structure, field composition, distance dynamics, surface behavior, and track-specific tendencies. These elements are integrated into a unified analytical view that explains not just which horses rate well, but why the race is likely to develop the way it does, including on turf through a dedicated turf model designed to capture the distinct pace patterns of turf racing.
Each Track-IQ Report is built around a decision-oriented analytical process grounded in established handicapping theory. The analysis begins by estimating true win probabilities for every entrant, derived from repeated simulations and probability aggregation. From there, the report outlines the projected pace structure of the race and identifies the runners most likely to influence it. This framework allows Track-IQ to detect situations where the betting market may diverge from the model’s expectations. At the center of this process are Model Odds, which represent an objective estimate of fair value after all relevant variables have been evaluated together. These odds provide a clear baseline for identifying potential overlays and assessing wagering risk.
The report itself is designed for clarity and usability. Information is organized in a clean analytical hierarchy so the reader can quickly understand the context of the race while still having direct access to the metrics behind every conclusion. Core selections—Primary, Secondary, and Tertiary—are accompanied by concise race notes that explain the specific factors driving each ranking, such as pace advantage, late-strength potential, favorable track fit, or statistical value signals. This structure allows players to scan for key insights quickly while still having the depth needed to evaluate the race more carefully.
A defining feature of the system is the proprietary Chaos Index, a quantitative measure of race volatility. The index analyzes several structural characteristics of the field—including probability dispersion, pace pressure balance, early-versus-late performance differences, and clustering of competitive ability—to estimate how stable or unpredictable the race environment may be. Lower readings suggest form-driven races where probabilities are relatively stable, while higher readings indicate compressed or volatile fields where outcomes are more sensitive to variance. By combining probability modeling, structural race analysis, and clear presentation, Track-IQ provides a disciplined framework for identifying opportunity while managing risk in the wagering market.
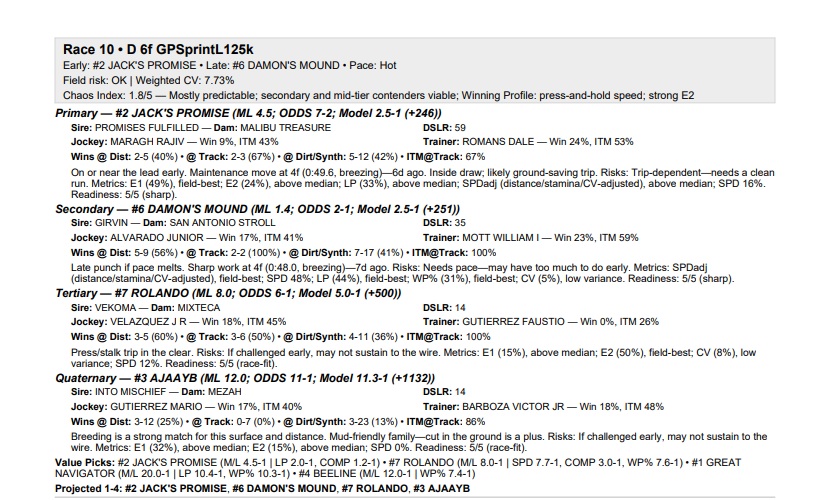
The overhead image shows the Track-IQ analysis of race 10 at Gulfstream on Feb. 21, 2026. In that race, the $125K Gulfstream Park Sprint Stakes at 6f on the dirt, the Primary Selection, #2 Jack’s Promise, had fair-value odds of 5-2 compared to final odds of 11-1. The pool undervalued his form, with Jack’s Promise having strong win probabilities in E1, E2 and LP (49%, 24% and 33%) and 16% win probability according to SPD (about 5-1 strength). In the race, Jack Promise broke well from the gate and took the lead through the opening quarter. Though he lost momentum and the lead around the far turn, the horse re-rallied coming out of the turn and down the stretch to get the victory. Jack’s Promise paid $24.80 for the win. The race illustrates the value of the Track-IQ approach and customization in modelling a Gulfstream sprint race.
Below is the full Track-IQ Report for Gulfstream Park from Feb. 21, 2026.
https://www.offtrackbetting.com/results/36/gulfstream-park-20260221.html
For more results with the Track-IQ Report, see the Handicapping Page.
