TrackIQ Report
Overview
The TrackIQ Report is built for horseplayers who want straight, dependable information—and who know that odds, figures, and opinions only tell part of the story. It takes the full power of the Pro-Handicap Wizard engine—thousands of simulations, probability modeling, and AI-driven pattern recognition—and translates it into a clear, readable view of how each race is likely to take shape. The presentation is intentionally simple, but the foundation goes deeper than traditional analysis, accounting for track tendencies, distance behavior, surface dynamics, and a dedicated turf framework that reflects how differently grass races actually unfold.
Each report follows a practical, handicapping-first structure designed for real decision-making. It begins with true win probabilities for every horse, then outlines the projected pace scenario, identifies the runners most likely to influence the race, and highlights where value may be developing. At the center is Model Odds—a single, objective estimate of what each horse should be priced at once all relevant data has been weighed. It’s a disciplined reference point that helps players evaluate risk clearly before committing to a wager.
The TrackIQ Report is intentionally minimal. There’s no clutter and no noise—only information organized for clarity and use. Every section serves a specific purpose, allowing players to grasp the key dynamics at a glance or dig deeper into the supporting metrics when needed. Whether you skim or study, the report provides a steady, confident framework for approaching every race on the card.
Anchoring the system is our proprietary Chaos Index — a mathematical model that measures a race’s volatility. It evaluates the makeup of the field: probability spread, pace-pressure balance, early-late performance gaps, competitive clustering, and the overlap between running styles. Those factors are combined through a multi-weighted, non-linear algorithm to produce one value that reflects how tight or unpredictable the race is likely to be. Low readings point to stable, form-driven outcomes; high readings signal greater volatility and longshot potential. It’s a single number, built from many moving parts, and it sets the tone for how the entire race should be approached.
- To see the image in high-resolution, click on it and then on the encircled “i” in the bottom right. Scroll down and click on the “view full-size” link at the bottom center.
Premium Racing Report Features
Race Notes & Horse Tiers (Primary, Secondary, Tertiary)
Each TrackIQ Report includes targeted race notes beside the Primary, Secondary, and Tertiary selections. These notes highlight the specific attributes driving a horse’s ranking: pace advantage, late-strength potential, track fit, longshot value signals, improving form cycles, or metrics that outperform the field. Rather than providing long, generic comments, the notes read like distilled insights—identifying the most meaningful reasons the horse belongs in that tier. Primary horses represent the strongest combined probabilities; Secondary horses offer competitive edges or solid value; Tertiary horses are conditional players shaped by pace flow, volatility, or price.
SPDadJ — Adjusted Final Speed
SPDadJ is a refinement of raw final-speed performance. It incorporates the 1,000-run simulation results while adjusting for track tendencies, distance nuances, surface characteristics, and historical variation. The result is a more realistic indicator of final-speed potential for today’s race—not just a reflection of past figures.
COMP — Composite Performance Probability
COMP is a proprietary combined metric derived from the individual win probabilities of SPD, E1, E2, and LP. Instead of treating those pace and speed elements independently, COMP synthesizes them into a single probability that expresses a horse’s overall competitive strength. This metric excels at identifying balanced contenders who may not dominate one category but perform strongly when the full picture is considered.
WP% — Win Percentage (Stakes-Adjusted In-the-Money Measure)
WP% measures how often a horse finishes in the money, adjusted for the stakes level of the races it has run. Higher purse values generally indicate stronger company, so the adjustment provides a clearer sense of how a horse performs when the financial and competitive pressure increases. Once converted into theoretical odds, WP% becomes a quick way to spot runners whose past performance is being mispriced — revealing longshots with hidden consistency or favorites whose record may flatter them.
CV — Coefficient of Variation (Risk Factor)
CV measures the instability and variance in a horse’s performance profile. A low CV indicates a consistent, reliable runner; a high CV points to volatility, upside, and uncertainty. CV is one of the most effective indicators of whether a horse is likely to run to form or capable of producing an unexpected performance—particularly valuable in high-chaos races.
How the PDF Is Organized & How to Read It
The TrackIQ Report is structured in layers so that horse players can gather insights quickly or explore deeper details as needed:
Race Header – identifies the race type, conditions, distance, and class, offering immediate context.
Chaos Index – the first read; signals whether the race leans toward form or volatility.
Horse Rankings – lists true win probabilities derived from simulation and AI modeling.
Primary / Secondary / Tertiary Selections – the core recommendations, supported by concise race notes.
Metric Table (SPDadj, E1, E2, LP, COMP, CV) – the analytical core behind the rankings, shown at a glance.
Value Indicators – highlight live overlays, underlays, and longshot potential within the field.
Readers can skim for actionable insights or examine the metric grid for deeper evaluation. The design is intentionally clean and minimal, ensuring the most meaningful information stands out clearly and immediately.
*Above PDF and Race Analyses Examples
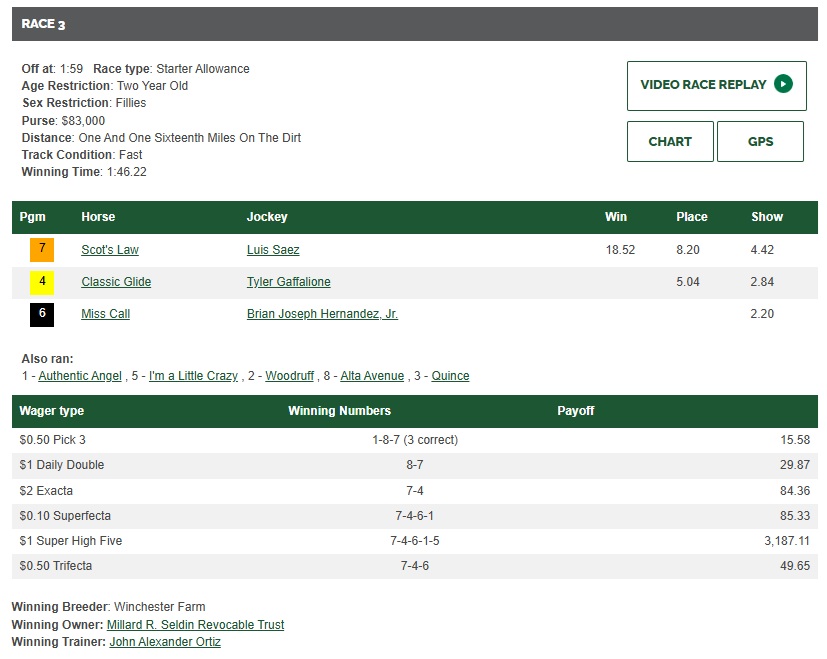
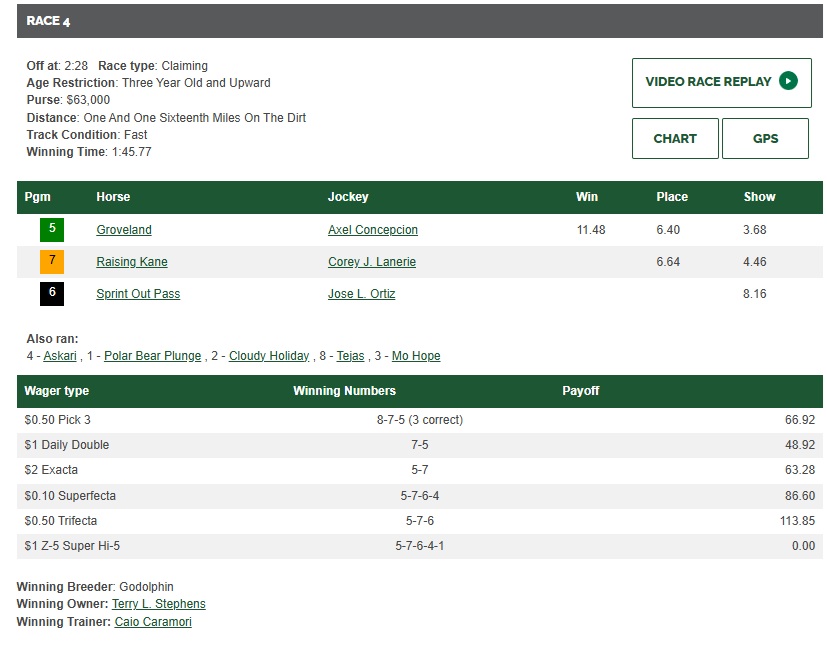
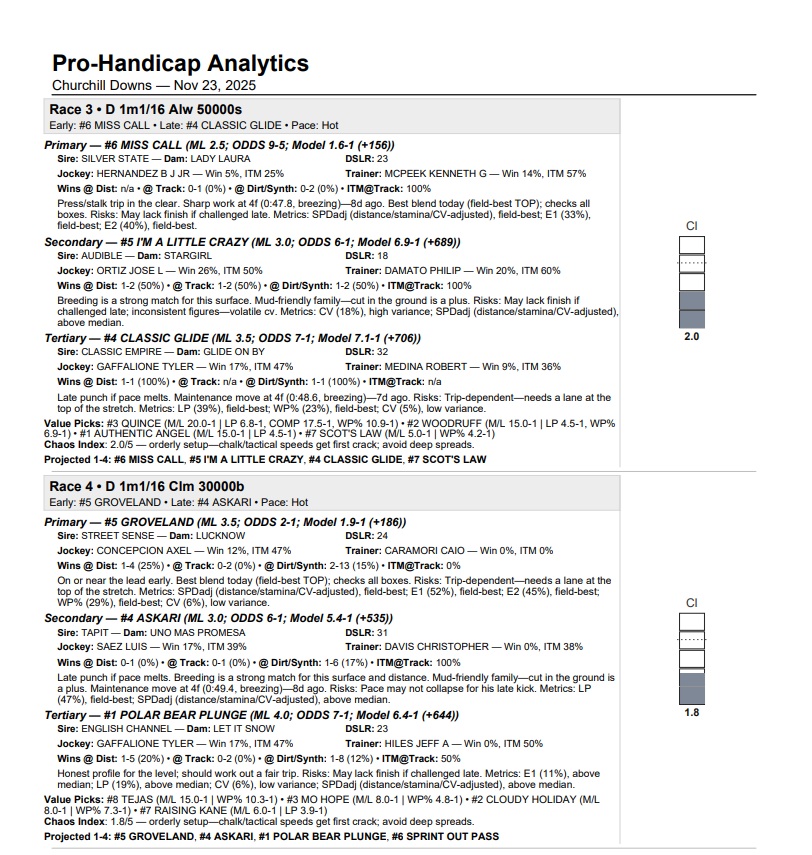
The above is the first page of the Racing Report for Churchill Downs (CDX) on Nov. 23, 2025. On this day, races 1 and 2 were excluded from consideration for being maiden races and lacking race data. Usually, mostly non-maiden races are shown in the PDF, though maiden races in certain cases will be shown when they have sufficient data. In the above example, #7 Scott’s Law was the winner in the 3rd, which had been identified as a value pick because of its discounted Win-Percentage adjusted for stakes converted to odds: ” (M/L 5.0-1 | WP%4,2-1)”. Scott’s Law final odds were 8-1/9-1, and the horse paid $18.52 for the win. In race 4, the primary selection, #5 Groveland, won at 5-1 as a significant overlay compared to Model Odds of 1.9-1. The horse paid $11.48 for the win.